 How-to
Combining Lab Results With Wearables: A How-To Guide
Table of Contents
- Why Combining Lab Results With Wearables Beats Either One Alone
- What You'll Need Before You Start
- Step 1: Export and Standardize Your Data
- Step 2: Align Wearable Timelines With Your Testing Windows
- Wearable Metrics to Track for Metabolic Health
- How to Interpret Lab Results With Health Data
- Health Data Integration Tools That Do the Heavy Lifting
- Sharing Health Data With Your Doctor
- Frequently Asked Questions
Last Updated: October 18, 2026
Why Combining Lab Results With Wearables Beats Either One Alone
Combining lab results with wearables means pairing periodic blood test results with continuous device data so each source explains the other. Your wearable sees your body every day. Your lab portal sees a single morning. Neither one tells the full story alone.
At eeMeds, we built our whole platform around that gap. A wearable shows what your body did for thirty days. A blood test shows what your physiology looked like on one of them. Put the two together and you get something closer to truth: trends with a reference point.
Here is the core tension most guides skip. Wearable data is continuous but shallow. Lab data is deep but rare. Continuous monitoring without lab tests can flag a change nobody can explain. Lab tests without device data can miss the context that makes a number meaningful.
Below, we walk through the full workflow: exporting and standardizing data, aligning timelines, pairing biomarkers with signals, interpreting the results, and sharing them with your doctor.
What You'll Need Before You Start
Total time: about 30 minutes for the first setup, then 15 minutes per lab cycle. Difficulty: beginner.
You do not need a technical background. You need a few files and a bit of patience.
- Your latest lab report, ideally as a PDF with reference ranges shown
- A wearable account with export access (most major apps offer this)
- A simple spreadsheet or a health data platform that accepts uploads
- A note of the exact date and time your blood was drawn
- Any medication list, including GLP-1 doses and start dates
- A short log of sleep, stress, and activity around the draw date
That last item matters more than people expect. A common mistake is treating the blood draw as a neutral snapshot. It rarely is. If you slept four hours the night before, or trained hard two days prior, your numbers carry that.
Step 1: Export and Standardize Your Data
Export your lab results as a structured file and your wearable data as a date-stamped export, then convert both to the same units before you compare anything.
Start with the lab. Download the PDF, then either request a CSV from the lab or type the key values into a spreadsheet: marker name, value, unit, reference range, and draw date. Keep the reference range column. You will need it later.
Next, export wearable data. Most platforms let you download activity, heart rate, sleep, and, where supported, glucose or temperature trends. Save each as a CSV.
Now the part people skip: standardizing.
Normalizing Units and Time Zones
Unit conversion is where most home-built comparisons fall apart. Labs may report glucose in mg/dL or mmol/L. Weight may appear in pounds or kilograms. Distance in miles or kilometres. Pick one unit per measure and convert everything to it before you look at a single trend.
Time zones cause the quieter problem. A wearable records in your local time. A lab may timestamp in the facility's time zone. If you travel, or if the lab sits in a different zone, your "morning" readings can drift by hours.
Fix both with a simple rule set:
- Convert every value to one unit per measure, and note the conversion in a header row
- Store all timestamps in one time zone, ideally the one you slept in
- Add a column for data source so you can trace any value back
Step 2: Align Wearable Timelines With Your Testing Windows
Timeline alignment means matching your continuous device data to the exact window around your blood draw, so the two describe the same period.
Set a testing window: the day of the draw plus the two or three days before it. That window is your comparison zone. Anything outside it is background.
Why the days before? Because many blood biomarkers respond to recent behaviour. Sleep, hydration, training load, and alcohol all shift results within days. A wearable summary of that window gives the lab value a context it otherwise lacks.
Build a simple alignment table for each lab cycle:
| Data Layer | Time Range | Purpose |
|---|---|---|
| Lab draw | Single timestamp | Reference point |
| Pre-draw window | 72 hours before | Recent behaviour context |
| Rolling baseline | 30 days before | What "normal" looks like for you |
| Post-draw tracking | 14 days after | Response and trend |
Keep the rolling baseline. A single bad night means little. Fourteen short nights in a row, followed by a shifted lab value, means something worth raising with your clinician.
This is also where data synchronization habits pay off. If you log a lab draw date in the same place you view your sleep and activity, you stop relying on memory.
Wearable Metrics to Track for Metabolic Health
The wearable metrics worth tracking for metabolic health are heart rate, heart rate variability, activity levels, sleep patterns, and glucose patterns where your device supports it.
Not every device measures everything. Work with what you have.
- Resting heart rate: a slow drift upward over weeks can accompany stress, illness, or poor recovery
- Heart rate variability: useful as a personal trend, not a universal score
- Activity levels: step counts and active minutes give context to glucose and weight trends
- Sleep patterns: duration and consistency, not just a single night's score
- Glucose patterns: only where a device or sensor supports it, and always as trends
Pairing Biomarkers With the Right Signals
Specific pairings make interpretation far easier. Match each blood biomarker to the wearable signal most likely to explain it.
| Blood Biomarker | Wearable Signal to Pair | What to Look For |
|---|---|---|
| Fasting glucose | Glucose patterns, sleep duration | Short sleep in the pre-draw window |
| HbA1c | 90-day activity and glucose trends | Sustained activity changes, not one week |
| Lipid panel | Activity levels, weight trend | Training load in the prior weeks |
| Inflammatory markers | Sleep consistency, resting heart rate | Clusters of poor recovery |
| Vitamin D | Outdoor activity and daylight exposure | Seasonal activity patterns |
These pairings are starting points, not diagnoses. They tell you where to look, not what to conclude.
How to Interpret Lab Results With Health Data
To interpret lab results with health data, read the lab value against its reference range first, then ask whether your wearable data explains the position within that range.
This is the step where most people go wrong. They see a value near the edge of the range and panic, or see a value mid-range and relax. Both reactions ignore context.
Work through it in order:
- Check the reference range. Is the value inside it, and by how much?
- Check the trend. Is this value stable across your last few tests, or moving?
- Check the wearable window. Did sleep, activity, or stress shift in the days before the draw?
- Check concordance. Does your device data agree with the lab direction, or contradict it?
- Check the medication context. New GLP-1 doses, for example, change appetite, hydration, and weight, all of which touch lab values.
Concordance is the key idea. When your wearable trend and your lab trend point the same way, confidence rises. When they conflict, that conflict is itself useful information, and worth flagging to a professional.
One honest limitation: consumer wearables are not clinical instruments. Their value is in trends and patterns over time, not in single readings. Treat device data as context, never as a diagnosis.
Health Data Integration Tools That Do the Heavy Lifting
Health data integration tools pull wearable, lab, and symptom data into one view so you are not manually reconciling spreadsheets every cycle.
You have three broad options.
Manual spreadsheets. Free, fully under your control, and workable for one or two data sources. They fall apart once you add medications, mood logs, and multiple devices.
Device-native dashboards. Convenient, but each one only sees its own ecosystem. If you wear one device and use a separate lab portal, nothing connects them.
Unified platforms. These aggregate device data, lab results, and daily inputs into a single record. This is where eeMeds fits. Our platform is device-neutral by design, so it connects the apps and devices you already use rather than replacing them.
What most reviews miss is that integration is only half the job. The other half is explanation. A dashboard that shows you forty numbers without telling you which three matter is not helping. Look for tools that surface patterns and suggest a practical next step.
Privacy deserves a hard look here too. Before you sync anything, read the platform's data policy. Check who can access your record, whether you can export and delete it, and how consent is handled.
Sharing Health Data With Your Doctor
Sharing health data with your doctor works best as a one-page summary: your lab values, the wearable trends around each draw, and two or three specific questions.
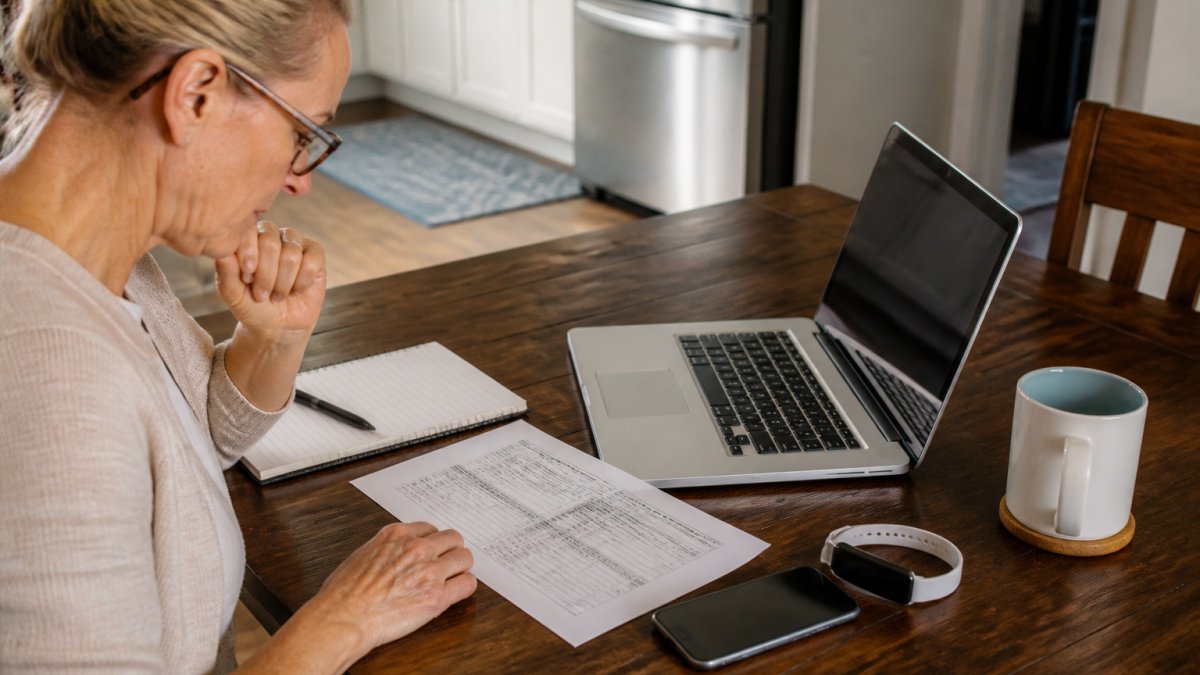
Doctors are short on time. A fifty-page export will not get read. A clear summary will.
Build the summary in this order:
- The lab values with dates and reference ranges
- A short wearable summary for each testing window
- Any medication changes in the same period
- Two or three specific questions you want answered
Then say what you noticed. "My resting heart rate climbed for two weeks before this draw and my fasting glucose moved up slightly. Should we look at that together?" That is a far more useful opening than handing over a folder.
This is also where virtual care earns its place. eeTeleHealth Plus™ connects you with licensed professionals for convenient consultations, which makes it easier to review a data summary between in-person visits.
A final boundary worth stating plainly: no article, app, or AI insight replaces a qualified clinician's judgment. Use your combined data to ask better questions, not to reach conclusions on your own.
Your wearable and your lab portal will keep producing data whether or not you connect them. The difference is whether that data becomes a trend you understand or a pile of numbers you scroll past.
Frequently Asked Questions
How do you combine wearable data with lab results?
Start by exporting both sources into a format you can compare, then standardize units and time zones so the numbers line up. Match each lab draw to the wearable readings from the days around it, not just the morning of the test. Look for trends across weeks rather than single-day spikes, and note anything unusual like travel, illness, or a missed workout that could explain a shift. Finally, bring a short summary to your clinician so they can interpret the combined picture with your medical history in view.
What wearable metrics are most useful alongside blood test results?
For metabolic health, the most useful signals are resting heart rate, heart rate variability, sleep duration and consistency, step counts, and continuous glucose patterns if your device supports them. These pair well with HbA1c, fasting glucose, lipid panels, and inflammatory markers. Activity levels and sleep patterns help explain changes in blood biomarkers that would otherwise look unexplained. Track a small set consistently rather than many metrics sporadically, because trends over weeks carry more meaning than any single reading.
Can wearable data help explain changes in lab results?
Sometimes, yes. A jump in resting heart rate alongside poor sleep and lower activity may line up with a change in inflammatory markers or glucose control. Wearables provide continuous context that a single blood draw cannot, showing what was happening in the weeks before the test. That said, wearable data cannot confirm a cause. It flags patterns worth discussing with a clinician, who can weigh them against your history, medications, and other test results before drawing any conclusion.
How often should wearable data be compared with lab results?
It depends on your goals and your clinician's guidance. For general wellness, reviewing trends every three to six months alongside routine bloodwork is a reasonable rhythm. If you are managing a chronic condition or adjusting medication, your clinician may want more frequent comparisons. The key is consistency: use the same metrics, the same time windows, and the same device where possible, so the comparison reflects real change rather than measurement noise or a device swap.